Diagnostic tools
The Tools menu holds utilities you open to answer one question and then close. Its Diagnostics group has four: Frequency planner, Speed test (iperf), Continuous ping / latency and Traceroute. The other two entries in the menu have their own guides: Compare snapshots (Links group) is explained in History, and the Network rating (Reports group) in its guide.
Frequency planner
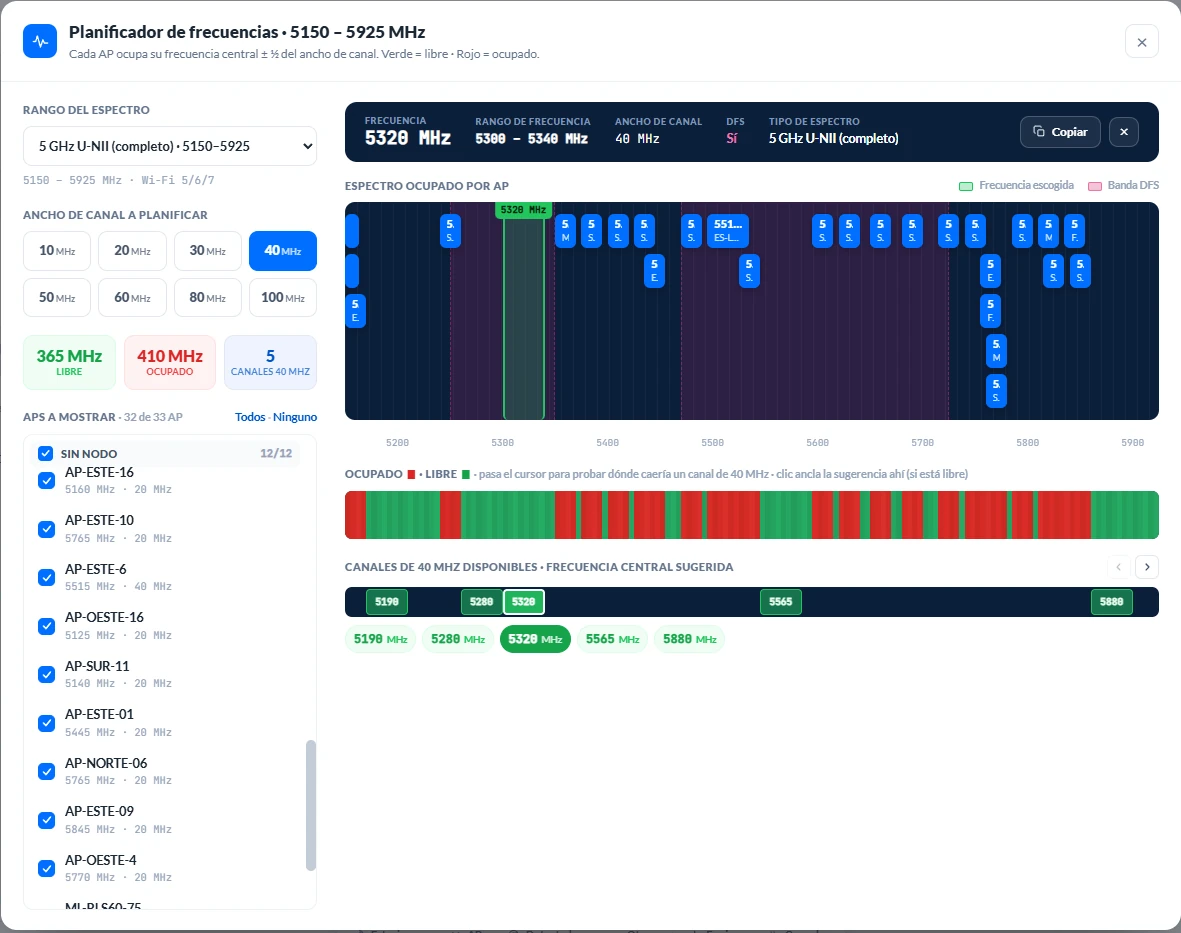
Shows which part of the spectrum your APs already occupy and where a new channel fits without overlapping them. It works with what monitoring already read from the APs with a session, never queries the radios, and refreshes on its own.
In the left column you choose three things:
- The spectrum range: 2.4 GHz ISM, 3.65 or 4.9 GHz, 5 GHz U-NII whole or by sub-band (U-NII-1 to U-NII-4), 6 GHz (U-NII-5 to U-NII-8) or Custom…, with start and end in MHz.
- The channel width to plan, from 10 to 100 MHz.
- The APs to show. The list is grouped by node, with a checkbox that selects or clears the whole site, because spectrum is planned per tower ("let's see what this one has on").
The panel shows:
- The occupation lanes. Each AP occupies its center frequency ± half its width (5630 @ 20 MHz ⇒ 5620–5640). Hovering a block shows the AP's card: model, frequency, IP, SSID and stations.
- The spectrum strip, with DFS zones shaded. Hovering highlights the chosen width centered at that point, with its verdict (Free in green, Partial in orange or Busy in red) and the MHz breakdown.
- The suggested channels, as chips: the center frequencies that fit in the gaps without stepping on each other. The
‹ ›arrows slide the suggestions within each gap in case you prefer another center.
Clicking a chip or a free frequency selects that channel. Its summary appears on top: frequency, covered range, width, whether it falls in DFS (the radio may change channel if it detects radar) and the band. The Copy button puts the frequency on the clipboard so you can paste it into the radio's configuration.
The planner keeps its settings when you close it, because the usual routine is to go in, pick a channel, check it against the table and come back.
The plan is only as good as its readings
An AP without a session does not report a frequency yet: it appears dimmed inside its node and is left out of the plan. If three of a tower's six APs have not connected, that tower's plan is incomplete, and the planner leaves that in plain view instead of hiding it.
Speed test (iperf)
Measures real throughput machine to machine without sending any order to the radios: all of it is traffic between two iperf3-compatible endpoints. The modal has two roles:
- Server. SignalScope exposes a destination on the local IP and port you choose (5201 by default) and waits. After you press Start server, the destination is ready to copy, together with the
iperf3command the other end has to run. Incoming tests are listed under incoming sessions. - Client. SignalScope connects to another iperf3 server (another SignalScope or any
iperf3 -s) and runs the test. You pick the direction (upload, download or Duplex), the duration and the streams, and when it ends you see the average upload and average download.
The other end does not need SignalScope: any iperf3 works, and the modal includes the command to install it on Windows. For now the test runs over TCP only; UDP will come later.
- Windows asks for firewall permission the first time you start the server (standard dialog, no administrator). The modal warns you beforehand.
- The server keeps listening after you close the modal, until you stop it or quit the app.
- The test saturates the link while it lasts, and the customer notices. Run it at low-usage hours.
Continuous ping
Measures latency, jitter and loss nonstop against one or several targets. It is a measuring session with statistics, different from each row's ping button, which opens a console.
- Targets are picked by scope (Stations, APs or References), with a search box and a field to type an IP by hand. Under Stations the rows are grouped by their AP, and Select the whole sector checks every station on that AP at once. The AP table has a direct shortcut for the same thing.
- You choose the interval (500 ms, 1 s or 2 s) and whether the measurement is continuous or ends after a set time in seconds.
- Per target you see loss %, average, minimum and maximum, jitter and a chart of the latest samples. The verdict (Stable or Unstable) always gives its reason, including spikes, which are judged against the target's own baseline: a steady 60 ms does not alarm, but 2 ms jumping to 200 does.
- The modal can be minimized and keeps measuring. A pill stays in the corner with the summary.
- Results export to PDF, Excel and CSV.
This ping leaves your PC, so it measures something else
Continuous ping leaves your PC and crosses the whole path. The table's Latency column is measured by the radio, over the air hop only. Comparing the two helps the diagnosis: high ping with low air latency means the bottleneck is not in the air.
Traceroute
Shows the route to a target, hop by hop, with the latency and loss of each one. You pick the target from the list or type an IP or host name, and DNS name resolution is optional. There are two modes:
- Single shot: three probes per hop, then it stops. Useful for documenting the path.
- Continuous: probes every hop until you stop it, MTR-style. It can also be minimized.
Hops that are your network's radios are highlighted with their model and frequency, so you see at which point of your infrastructure the route degrades instead of a list of anonymous IPs.
If a hop loses packets and the following ones do not, that loss belongs to the control plane: the router rate-limits its ICMP replies (typical of MikroTik) and traffic passes. The screen labels it as control-plane loss, and only loss that carries through to the end counts toward the verdict.
Results also export to PDF, Excel and CSV.