First steps
Getting from a freshly installed app to your network monitored live takes four steps: create the project, register your networks, scan, and sign in to the radios.
1. Create your first project
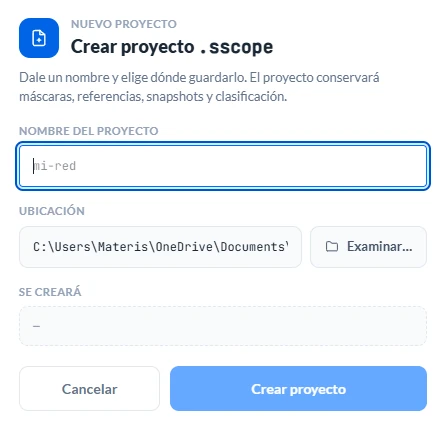
On the welcome screen, click New project. You choose its name and where to save it, and it is created as a .sscope file.
That file is your whole network (devices, encrypted credentials, baselines, Snapshots and history) and it autosaves as you work.
2. Register your networks
In the scan panel, networks are registered as CIDR ranges (for example 192.168.1.0/24) and shown as chips you can toggle on and off. The scan only sweeps the ones that are on.
A new project starts with no networks, and the app offers your own PC's networks as chips with a + and a dotted border. One click registers the one you want; nothing is added without that click. Other segments you manage are typed by hand into the field. The widest range accepted is /16.
3. Scan
Press Scan (or Scan all). The app sweeps the active networks with ping, shows per-network progress, and you can cancel at any time.
Everything that responds shows up in the Detected table with its IP, MAC and manufacturer, plus a Suggestion column hinting at what each device looks like: "Ubiquiti radio", "MikroTik radio", and so on.
When it finishes, the app tells you how many devices responded ("Scan finished · N devices responded.") and takes you to the Detected table, where the findings are waiting.
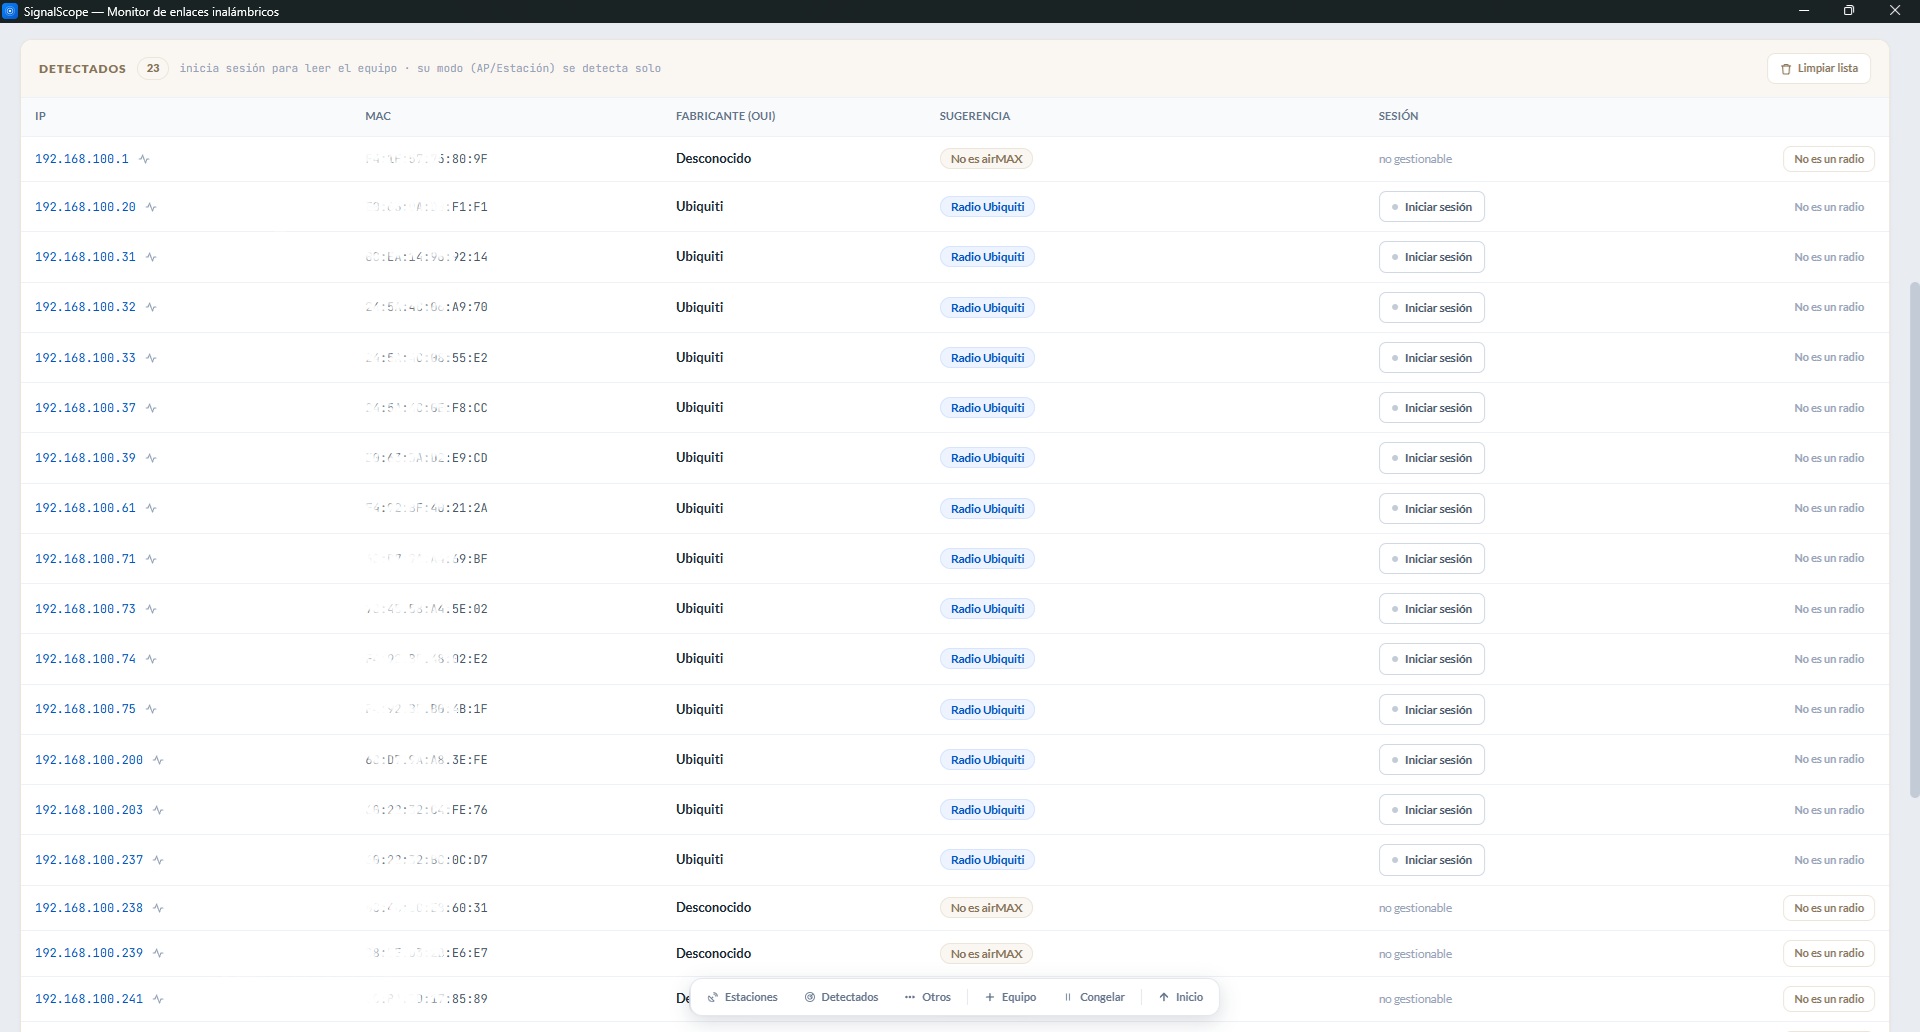
A device says "MAC not reachable". What does that mean?
It sits behind a router (outside your local network), and from that distance the scan only sees its IP. It is not a problem: when you sign in, the device identifies itself fully, MAC included.
4. Sign in to the radios
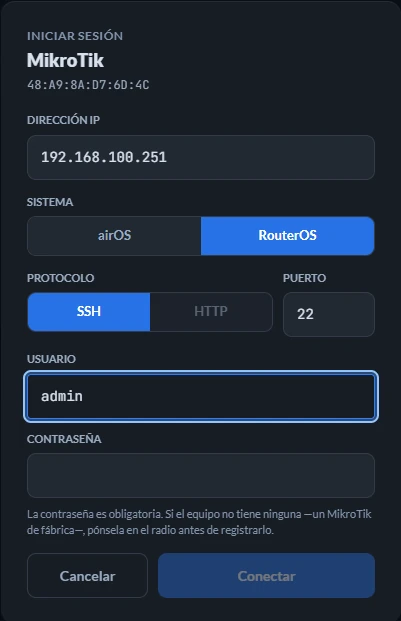
Radios need a session to report their metrics. Use the credentials of their own interface (airOS or RouterOS, depending on the device) and pick its System in the sign-in window. It comes preselected from the manufacturer the MAC revealed, and changes with one click. The password is required: the app does not register a device without one, because it would be open to anyone.
- With airOS you pick the Protocol: SSH, the default, or HTTP. If your account is read-only, use HTTP, because airOS does not give SSH to those accounts.
- With RouterOS the transport is forced to SSH and the HTTP option is disabled for compatibility.
There are two ways to do it:
- Individually: the Sign in button on the device's row.
- Cascade session: the time-saver for the first run. It applies the same credentials to every device without a session at once, with Connect all. Those that fail are marked to retry individually with their own credentials. The whole batch uses a single system: if you have both airOS and RouterOS devices, run the cascade once for each, and the second run retries the ones left unconnected.
Upon connecting, each radio reports its mode and classifies itself as a Station or an Access point, so there is nothing to classify by hand. Credentials are stored (encrypted inside the project) and the app uses them to reconnect automatically in future sessions.
Anything you will not manage (an ONU, a switch, other routers) goes to References with "Move to References…". It asks for its name if you want to watch it, as explained in the introduction.
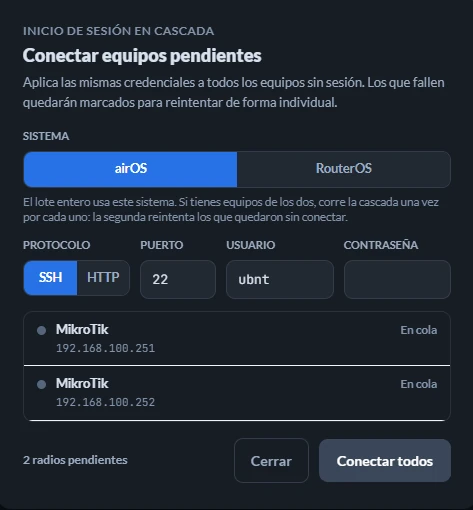
A MikroTik with two radios leaves two rows
That is expected: a box with its 2.4 GHz AP and its 5 GHz station takes one row per radio, even though it is a single session. What belongs to the device (CPU, memory, ports) repeats identically in both. The details are in Supported devices.
You are now monitoring
With sessions open, the tables refresh on their own: signal in dBm (local and remote), traffic light, throughput, distance, uptime. From here on:
- Set baselines. When a link is healthy and stable, "Mark" pins its signal at that instant as the antenna's baseline. From then on the app judges how far it has dropped from that point, with the states "Stable", "Dropped vs baseline" and "Check link".
- Save a Snapshot of the network's initial state with Save snapshot. It will serve as a point of comparison.
The next guides cover the interface in detail and how to read the traffic light and the diagnosis.
A radio the scan cannot find?
If a radio lives in a segment you cannot scan, register it by hand: the Device (+) button on the bottom rail opens the sign-in dialog with an editable IP.