Sentinel and network score
Two tools work on the same diagnosis. The sentinel warns you about the faults the signal does not reveal while you are busy with something else, and the score sums up the fleet's state in one grade.
The service sentinel
A link can look perfect (excellent signal, 100 % quality) and the customer can still be without service, because a loose LAN cable does not touch the signal. The app is centred on the signal, and the sentinel exists to watch exactly the faults that do not show in the traffic light.
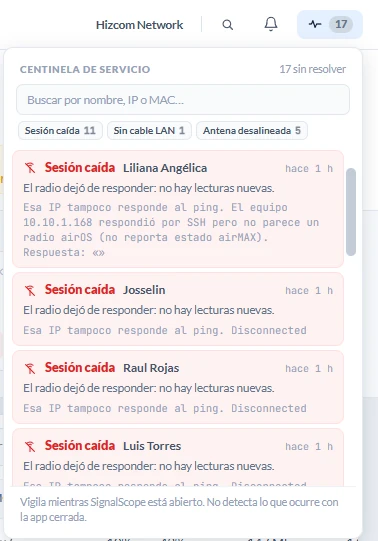
It lives in the pulse at the right-hand end of the bar, in the same spot in the Monitor and in the Map. Its number says how many devices are broken right now.
What it watches
Eleven events with eight switches. Three events have no switch of their own and inherit their partner's, because they are the same watch told a different way:
| Notice | What it detects |
|---|---|
| Access point down | An AP that was online stops answering. It is reported once for the node, with how many stations it drags along, instead of one alert per client. (Inherits the "Session down" switch.) |
| References not answering | A target in References with monitoring on stopped answering the ping. It reports after two failed checks in a row, and never for one that has never answered. |
| A watched device's IP is taken by another | That IP answers, but there is a different MAC behind it. (Inherits the "References not answering" switch.) |
| Session down | A station that was online stops answering. Anything that never connected is not reported. |
| LAN cable unplugged | A watched port lost its cable: the air link looks fine, but service is not going out through it. |
| LAN at 10 Mbps | A watched port negotiates at 10 Mbps: damaged cable, moisture in the connector or loose PoE. No airMAX ships with that maximum. Also on APs, where the uplink port strangles the whole sector. |
| LAN at half duplex | A watched port negotiated badly and service goes out degraded without the signal showing it. Also on APs. |
| Antenna misaligned | Imbalance between the two polarities from 6 dB, the limit Ubiquiti itself recommends. It points to an aiming or polarization problem. |
| Radio saturated | CPU at 95 % or free memory below 5 %: the radio drops packets with the signal intact. It applies to stations and APs. |
| Sector with high latency | Most of one AP's online stations (at least three, and half or more) answer slowly at the same time. It is reported once for the node, and its stations do not report one by one. (Inherits the "High latency" switch.) |
| High latency · BETA | A client with a pristine signal that still answers with sustained delay. |
Notices stack by severity. First comes what leaves a whole cell without service, then what affects one client, then what degrades it, and last what anticipates a problem.
Which ports the sentinel watches on each device is chosen in the Ports tab of its session window. The app reads every port on the device; if you make no choice, it watches the first one, which on an airMAX is the only one. Even if two watched ports fail, there is one notice per device, and it names the affected port.
What it does NOT watch, on purpose
Signal, noise, link quality, capacity and traffic stay out because they vary with rain, wind and whatever the customer is downloading. If they were in, the panel would fill up every day and within a month nobody would open it. The sentinel only admits conditions that fail in binary and that a healthy network does not produce. Latency is the only exception, measured and filtered.
How it behaves
- It confirms before warning. A condition must hold for 10 seconds (90 for antenna misaligned and for latency), so a port blinking during a reboot does not trigger a site visit.
- One alert per device and condition while it lasts. When it clears it is marked "Resolved" and retires itself after ten minutes. Clearing requires measuring: if what dropped was the session, the fault is not declared resolved. It stays as "Unchecked" and warns again as soon as the device answers.
- It does not repeat itself. After clearing, antenna misaligned does not warn again about the same device for 12 hours, and latency for one hour, unless the value has got worse.
- It reports the cause, not the consequence. If an AP drops, the AP is reported and its stations go quiet, so a downed node does not bury the panel under fifty notices.
- Missing data is never a fault. If a firmware does not report the port, that axis is not evaluated for that device. That is what happens with several metrics on RouterOS.
- Freezing the tables does not stop it, because the sentinel watches the background monitoring, not what is painted on screen.
- It does not depend on which screen you are looking at. With the project open it watches from the Monitor, from the Map, from the start screen and with the window tucked away in the tray. The start screen shows it with the "Monitoring" state.
The panel, and what you can filter in it
Every alert card is a button that takes you to the device, and it clears the state filter so you do not land on an empty table. With more than six alerts a search box by name, IP or MAC appears, and with two or more event types, chips per type to hide or show each one.
Both filters are per session and are not saved. They are for investigating, not a preference: if they survived a restart, you could open the panel tomorrow with a filter on and believe there were no faults. When something is hidden, the panel itself says so: "{n} hidden by the filter — show all".
The bar counter still counts every alert, because it reflects the network's state and not what the filter shows. A filter cannot lower the number that says how many customers are down.
What you decide per device
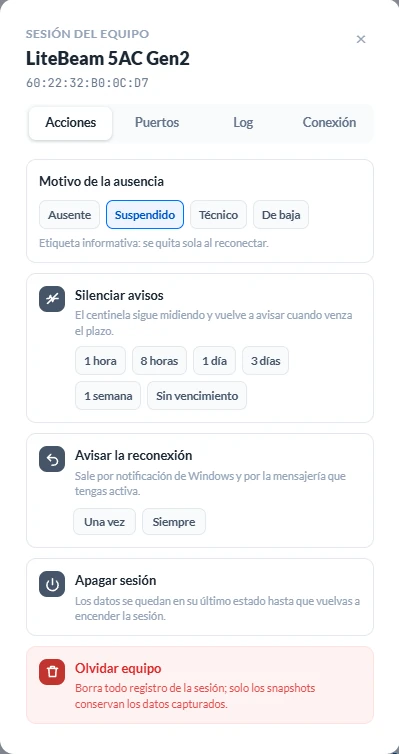
There are three decisions taken in a radio's session window (Actions tab) or in a target's actions in References. They are ordered from the most reversible to the one that is not, so your finger does not reach the red one out of momentum.
With the device absent, the same tab also offers the reason for absence (Suspended, Technical, Retired), an informational label that clears itself when the device comes back.
Mute alerts
A device with a fault you already know about (three days of roadworks, a customer who has not paid, an antenna you are swapping on Thursday) fills the panel with notices that inform nothing and hide the ones that do.
Muting is not ceasing to watch. The device keeps connecting and the sentinel keeps measuring it. The only thing that goes quiet is the output: the panel, the Windows notification and your messaging, all three at once.
- The period is the decision, so instead of one button there is a row of periods: 1 hour · 8 hours · 1 day · 3 days · 1 week · No end date. One week is the cap with a date. Beyond that, the period resembles "forever" so closely that it had better say so in those words, which is why the permanent one must be asked for by name.
- Once muted, the periods disappear and the card shows the state, for example "Muted until… · 8 h left", with a single way out: Unmute. To change the period, unmute and choose again.
- When it expires, whatever is still broken comes back with its real age ("for three days now") instead of looking as if it had just started.
- The panel reminds you whom you muted. At its foot there is a grey, folded block with the number of muted devices; opening it with "show" lists their period and their Unmute button. It counts every muted device, whether or not it has alerts today, because what must be remembered is the decision.
- It is stored in the project and not in the workstation's preferences, because it refers to a device on this network. It is lost when you forget the device.
Notify on reconnection
This is the opposite of muting: here you ask for more attention on a device. On the "Notify on reconnection" card you pick a mode and the app tells you when the device reconnects, by Windows notification and through whatever messaging you have enabled.
Neither mode comes preselected, because choosing is the action. Once set, the card states the mode and one click on it removes it.
| Mode | What for |
|---|---|
| Once | A customer went down, you leave to deal with something else and want to know it came back. It notifies once and clears itself. |
| Always | For the device you want to watch continuously: it notifies on every drop and recovery, until you remove it. |
The permanent mode does not turn into noise thanks to the cycle, with no need for a minimum time between notices. After notifying it goes back to waiting for a drop, so to sound again the device has to genuinely drop again. It notifies once per incident, not once per reading, and neither mode notifies twice for the same drop.
Three details prevent false expectations:
- On a device that is online, the notice first waits to see it drop. It does not notify you now, but when it drops and comes back.
- It cannot be set on something that is not being measured: a muted device, a target in References without monitoring on, or a monitored one whose first reply has not arrived. The card says which of the three it is.
- It is lost when you forget the radio or remove the target, because it travels with its record.
The output is governed by the "Came back online" switch, found in Preferences → Alerts for Windows and in Preferences → Messaging for each destination. That switch turns off the output; the notices you set on each device are kept.
Switch a device's session off
Switching the session off is not forgetting the device. The app stops connecting to it, so it costs no CPU and does not flood you with alerts, but it keeps its credentials and its record. You switch it off from its session window, above Forget, and back on with one click on its Session cell. It stays off even after you close the app.
The difference from muting is that here the device stops being measured. If you want quiet without losing sight of how it is doing, mute it.
Actions take the whole box
On a device with several radios (two rows, one session), switching off, muting or forgetting applies to both rows. The app warns you before you press.
The bell: what it told you while you were working
To the left of the sentinel's pulse sits the notice tray, with a bell icon. It keeps everything the app told you, with the time, and clicking each line takes you to the device.
They are two neighbouring indicators counting different things, which is why they were not merged into one:
- The pulse says what is broken now, and its alerts resolve themselves when the fault goes away. Its counter does not drop because you looked.
- The bell says what happened while you were not looking, and its notices are read and do not come back. Its counter is of unread items and disappears when you open it.
A reconnection that already happened still happened, and a loose cable is still loose no matter how long you look at it.
- The bell shows the time, not "how long ago", because a notice is read by when it happened, which is what you cross-check against what you were doing. A sentinel alert is read the other way round, by how long it has been broken.
- It is kept while the app is open, and the empty panel says so. It does not survive closing the app.
- It does not light the red dot on the Windows icon. That dot means "your network needs you", and the sentinel puts it there.
What reaches the bell:
| Notice | When |
|---|---|
| Came back online | A device you set Notify on reconnection on came back. |
| Needs your attention | The app paused a session it cannot solve on its own: unknown IP, account rejected or possible replacement. See what to do. |
| A labeled device came back | A device with a reason for absence came back; the label clears itself. |
| An AP changed its IP | The app found the AP at its new IP and reconnected on its own. For an AP that is not normal: check whether its address should be fixed. |
| This PC lost its network | Your PC has no active network. It is a single notice instead of one per device that stops answering, and another arrives when the network is back. |
Which of these notices also go out as Windows notifications or to your messaging is chosen in the "Notices you ask for" block, found in Preferences → Alerts and in Preferences → Messaging.
Three channels for the same notice
The sentinel always watches everything. What you choose is what leaves the app and through which channel:
- The panel shows every alert, always. Switching an event off in Preferences does not hide it from here.
- Windows notifications reach the desktop even with the app minimized or tucked away in the tray, and clicking takes you to the device inside its project, not to the start screen. They are turned on with the "Windows notifications" switch in Preferences → Alerts, and in the same place, under "What reaches the desktop", you pick which events arrive.
- The phone gets notices by WhatsApp or Telegram, with its own event selection (see below). Alerts and Messaging are independent settings: you may want everything on the desktop and only the serious ones on the phone.
Phone notices (WhatsApp or Telegram)
The same alerts can reach your phone, so you learn about an outage without being in front of the screen. There are three routes, all through CallMeBot: WhatsApp, Telegram to a user, or Telegram to a group.
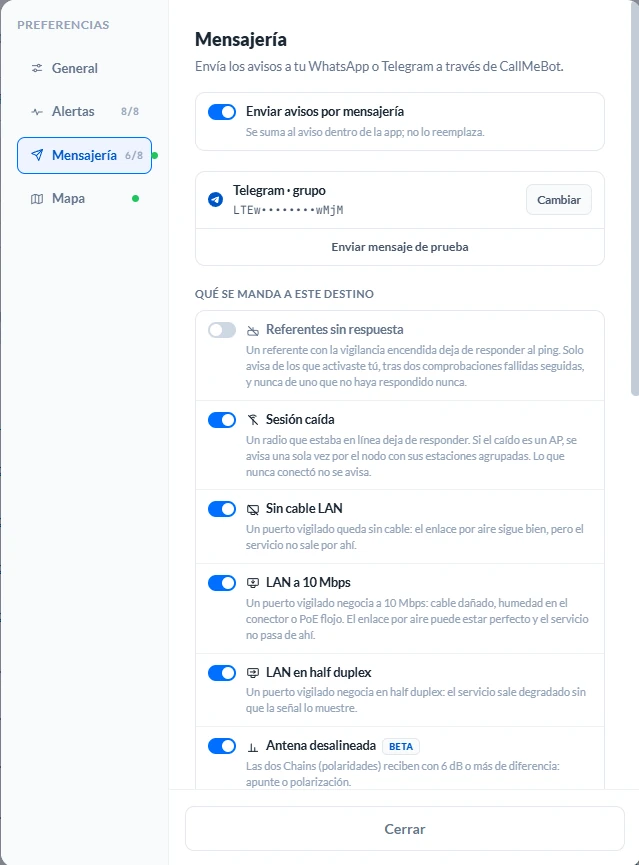
You enable it in Preferences → Messaging:
- Turn on "Send alerts by messaging" and choose the route under "Through where". Each route asks for its own details. WhatsApp needs the phone and the key; Telegram to a user, just your
@username; Telegram to a group, just the key (the key is the group). The "How to get these details" link leads to CallMeBot's instructions. Authorization is granted from your phone, and the app cannot do that step for you. - Send the test message with "Send a test message". It is not optional: CallMeBot validates nothing until a real send, and without the test you would find out about a mistyped key on the day a link goes down and no notice arrives.
- In "What goes to this destination", pick the events. Below it, under "Notices you ask for", pick which of the bell's notices also go out through this destination.
With the destination configured, the summary shows your number and key masked, so they do not travel in a screenshot or in a shared session.
What arrives: one message per alert type (not a summary), with the project and, for each device, its name, its IP and the AP it hangs off. The time is that of the first alert and not of the send, because what matters is when the customer lost service.
Each type has its wait and its tolerance. The wait is there to group: a power cut takes down several APs seconds apart, and that should arrive as a single message. The same wait discards transient faults. The table is also in the app, in the "What gets sent" dropdown under Messaging.
| Priority | Events | Wait | Not repeated for the same device within |
|---|---|---|---|
| 1 | AP down · LAN cable unplugged · References not answering | 20 s | 1 h |
| 2 | Session down | 1 min | 4 h |
| 3 | LAN at 10 Mbps on an AP | 1 min | 6 h |
| 3 | Radio saturated on an AP · Sector with high latency | 5 min | 6 h |
| 4 | LAN at half duplex · LAN at 10 Mbps · Radio saturated · High latency | 15 min | 12 h |
| 5 | Antenna misaligned · A watched device's IP taken by another | 30 min | 24 h |
The limits, plainly
- It watches while the app runs. Closing the window does not stop it: the app stays in the system tray, next to the clock, measuring. The first time you close it with a project open, the "SignalScope in the background" notice explains this, and its "Quit for good" button does close the app. To close it completely at any other time, use File → Quit SignalScope or right-click its icon in the tray. With notices arriving on your phone it is easy to believe this is a service running on somebody's server, but it runs on your machine.
- CallMeBot is a free third-party service, and it may be slow or fail. Do not use it as the only alerting mechanism for a critical service.
- Notices go out over your own internet. If your own link goes down, so do the notices.
- You do not pick devices, only event types. A list of specific stations in Preferences would take your network's identifiers outside the encrypted file. To silence ONE device there is muting.
- It does not send what was already failing when you opened the project. After a weekend the sentinel may detect forty outages at once, and none of them is news.
A Telegram group is an audience
The notice is read by the whole group, with your customers' names and IPs in it. Choose the group route knowing who is in it.
The network score
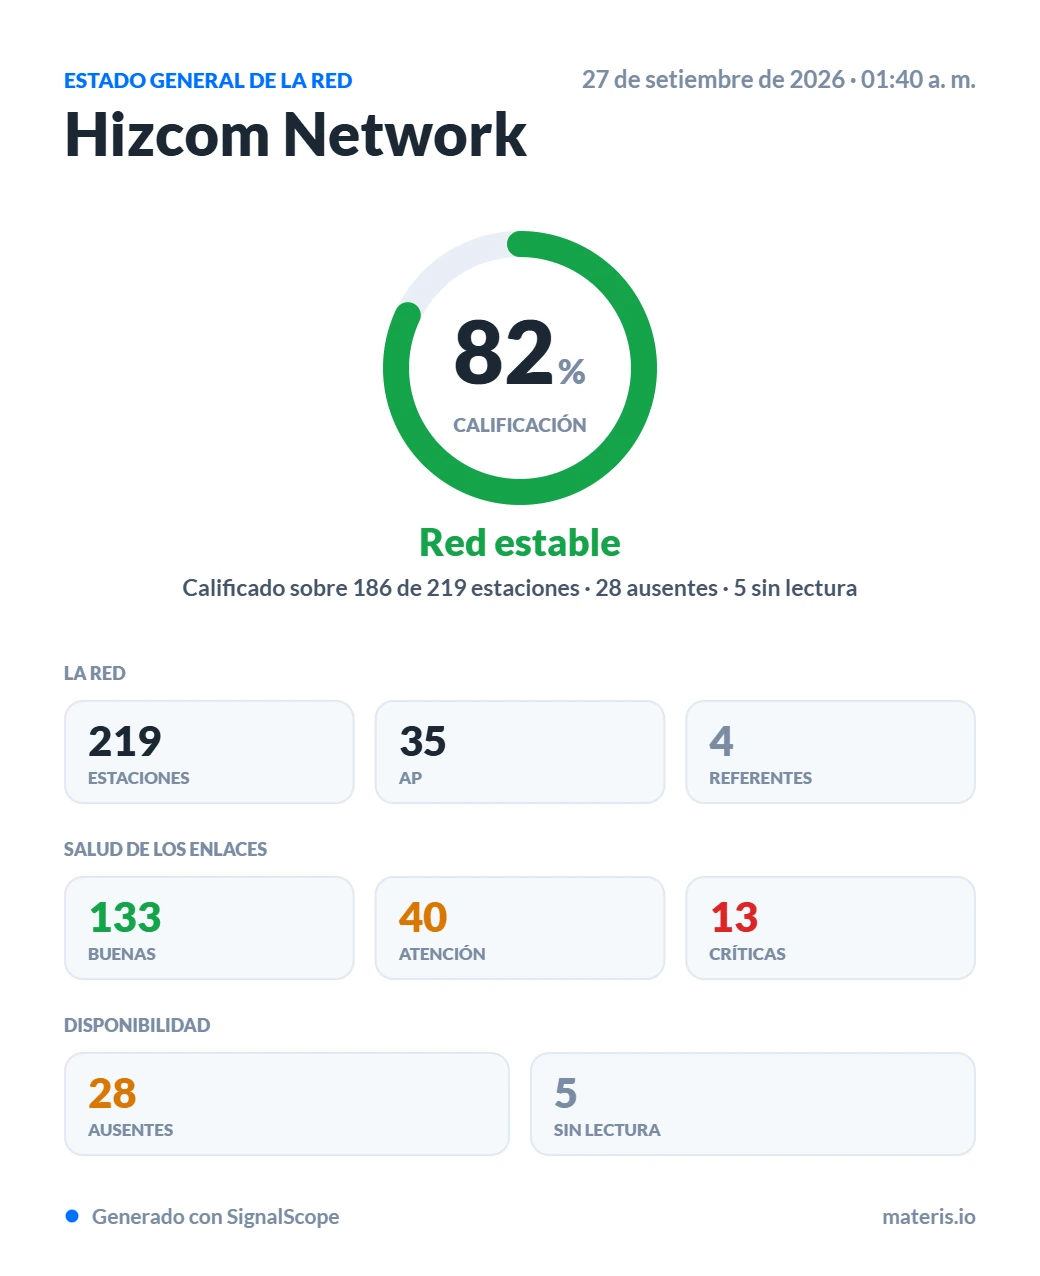
It is a grade from 0 to 100 for the whole fleet, meant to be shared: it downloads as an image ready to send to a partner or a customer.
The score does not look at the signal alone. It runs the full diagnosis on every station (the same one as the table, so they never contradict each other) and averages it.
| Score | Verdict |
|---|---|
| ≥ 90 | Excellent network |
| ≥ 75 | Stable network |
| ≥ 50 | Needs attention |
| < 50 | Critical network |
Two rules make it defensible in front of whoever receives it:
- The score always travels with its coverage: "Rated over N of M stations". A score that does not say how much was measured cannot be audited.
- No measurements, no score. It shows "Not enough data", not a 0 %. Absent stations do not penalize, because a customer who switches their antenna off at night is not a fault of your network; they are reported in their own block.
The card groups the information into three blocks (the network, link health and availability) and comes out identical on any machine, in light or dark theme.