Stations
The main table. One row is one customer antenna, refreshing live. On a MikroTik the row is a radio, as explained further down.
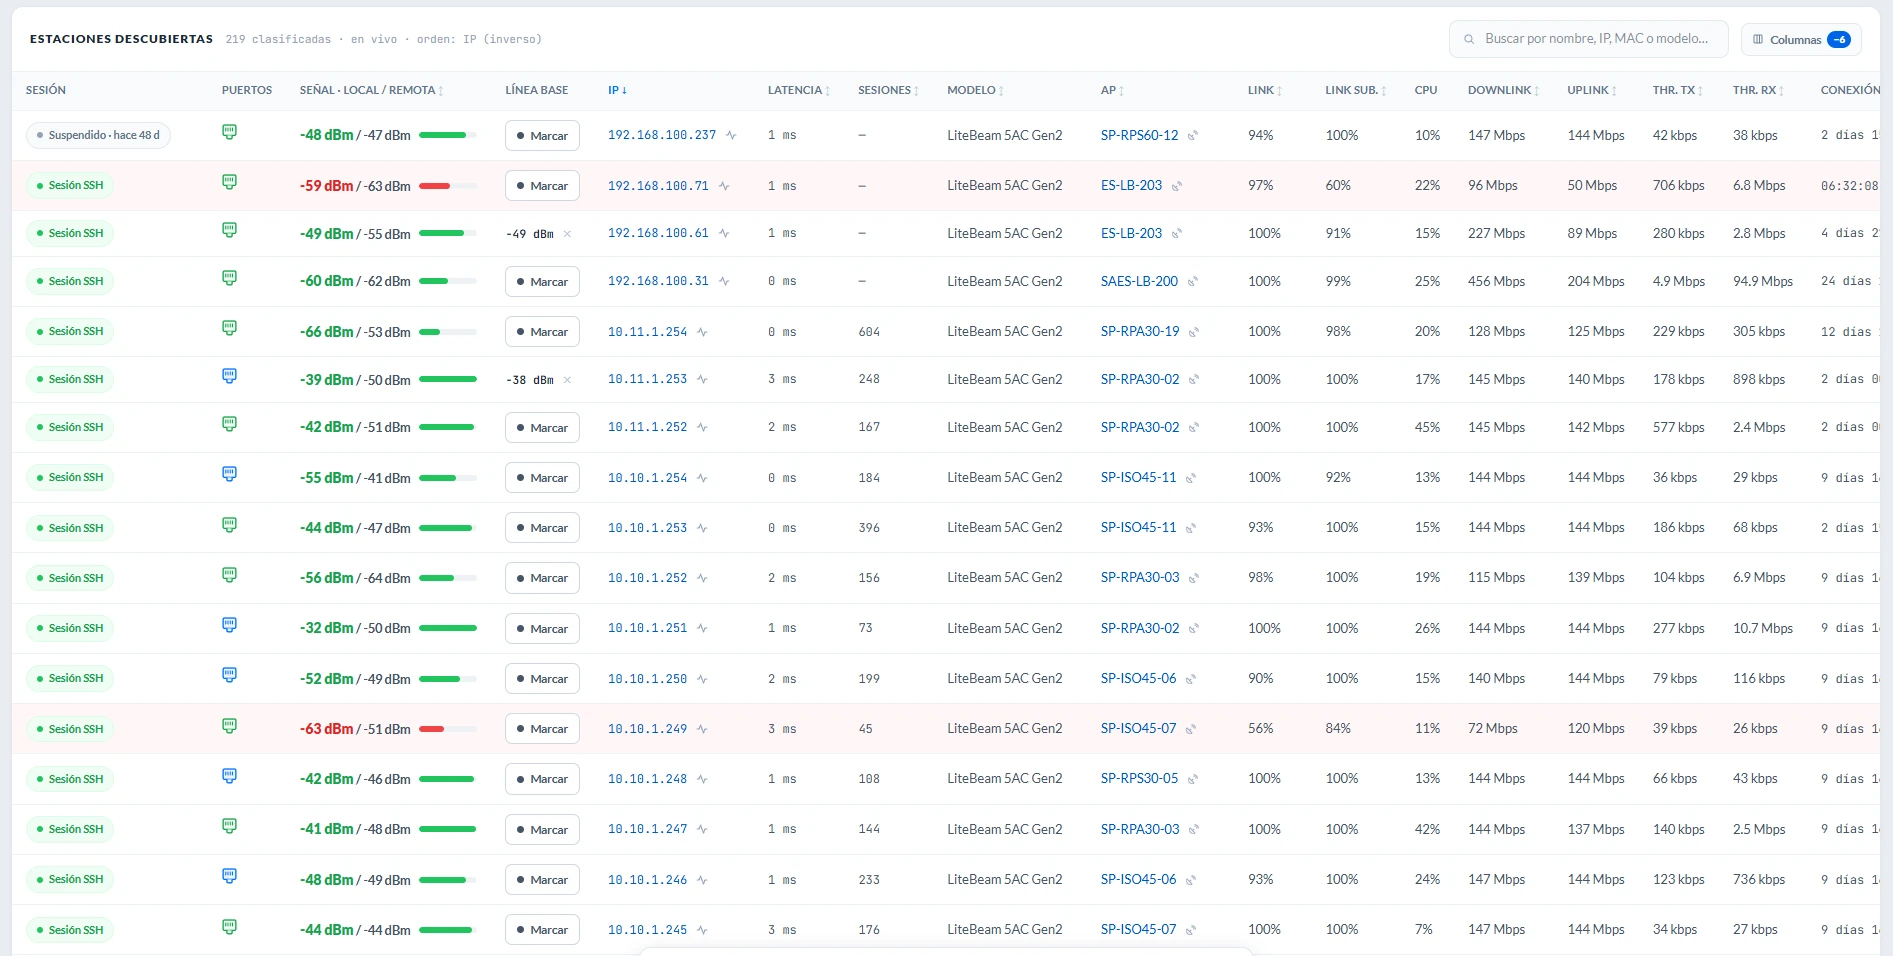
The columns
| Column | What it shows |
|---|---|
| Session | The state of the connection to the radio (SSH, HTTPS or HTTP) and, if it is absent, what is going on. It also carries the marks of what you decided about that device: session switched off, alerts muted, reconnection notice set. One click opens the session window. An HTTP session is painted amber with an open padlock, because on that network the username, the password and the metrics travel as plain text. |
| Signal · local / remote | The core reading. Local is what the station receives; remote (in gray) is what the AP receives from it. The meter bar carries the traffic-light color. |
| Baseline | The Mark button pins the current signal as that antenna's baseline, and the cell then shows that value (−58 dBm) with an × to remove it. With a baseline, the signal axis judges how far it dropped from it rather than the absolute value, and the status reads Stable, Dropped vs baseline or Check link. To update it, remove it first with the ×. See Traffic light and diagnostics. |
| IP | A link that opens the radio's web UI, plus a ping button that opens a terminal with a continuous ping. |
| Latency | The link latency measured by the radio itself toward its AP. It is not a ping from your PC; see below. |
| Sessions | The customer's simultaneous connections, counted by the radio when it works in router mode. Only available over SSH. It is informational: it tells a quiet customer from a busy one. |
| AP | The base station it is associated with. The name jumps to that AP's row; the antenna icon filters this table to its other clients. |
| Link | The airMAX downlink quality (%), averaged to avoid false criticals. When the device does not publish it, the cell shows the measure it does have, with its acronym and uncolored: CCQ on RouterOS and on airOS 6 over SSH, AMQ (airMAX Quality) on airOS 6 over HTTP. Neither has calibrated thresholds, so they are shown but do not drive the diagnosis. |
| Link up | The same airMAX quality on the uplink (%). It only has a value on devices that report the airMAX linkscore; CCQ has no direction and is not repeated here. |
| Modulation | Both directions, down and up (8x/1x). It is informational: it does not change the traffic light, but it explains a reduced capacity. See below. |
| CPU · Free RAM | The radio's health: how much CPU it uses and how much memory it has available (for free RAM, more is better). It is deliberately uncolored. The verdict comes from the diagnosis, which judges the sustained value rather than the instant. |
| Downlink / Uplink | The link's estimated capacity according to the AP. They are empty on airOS 6 devices, which do not compute it, and an empty cell there is the correct reading. |
| Thr. TX / RX | That link's traffic right now. It is empty on each session's first reading, when there is nothing to compare against yet. |
| Ports | Every Ethernet port on the device, one RJ45 connector per port, in the order the device names them. See below. |
| Name · Model · MAC · Firmware · Distance · Connection | Identity and context, as reported by the radio itself. Firmware helps spot outdated devices. |
Almost all of them can be hidden from the Columns menu, and the choice is remembered. Session, Signal, Baseline, IP and Link are always shown.
MikroTik devices: one row per radio
RouterOS devices are in beta: they work the same as airMAX, but they have been tested on fewer models. A MikroTik with several radios takes one row per radio, and each row is named after the device followed by its interface. The mode belongs to each radio, so one box can have a row here and another in Access points. A disabled radio takes no row.
What belongs to the box repeats on all its rows: CPU, memory, model, firmware, uptime and ports. It is one measurement seen twice.
Empty cells on MikroTik devices
Latency, Distance, Sessions and the remote signal come out empty on RouterOS, because that system does not publish them. An empty cell tells the truth, and a number that looks like a measurement without being one would not. The full list is in Supported devices.
The Session cell and what you decided
Besides the connection state, this cell carries the marks of what you decided about that device. There are three, with the same glyph as in the actions window: there they appear with their text beside them, and here they remind you at a glance.
| Mark | What it means | Where it is set |
|---|---|---|
| Session switched off | The app stops connecting to that device, so it costs no CPU and sends you no alerts, but it keeps its credentials and its record. It stays off even after you close the app. One click on the cell switches it back on. | Session window → Actions, above Forget device |
| Alerts muted | The device keeps being measured. What goes quiet is the output (panel, Windows and messaging) for the period you choose: 1 hour, 8 hours, 1 day, 3 days, 1 week or No end date. When the period ends it alerts again on its own; before that, you turn it back on with Unmute. | Session window → Actions |
| Reconnection notice set | The app will tell you when that device reconnects. | Session window → Actions |
All three are explained in Sentinel and network score.
Actions take the whole box
On a device with several radios (two rows, one session), switching off, muting or forgetting applies to both rows. The app warns you before you press.
The session window
One click on the Session cell of an already registered device opens its window, with four tabs:
| Tab | What for |
|---|---|
| Actions | What you decide about the device: reason for absence, mute alerts, notify on reconnection, switch the session off and forget the device. The window opens on this tab. |
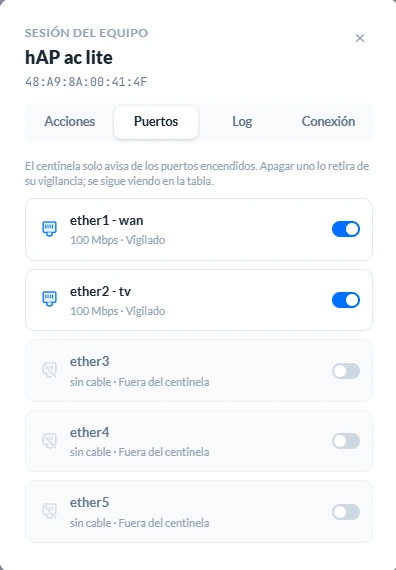
| Ports | Which Ethernet ports the sentinel watches. See below. |
| Log | What the app tried with that device and how each attempt ended. See below. |
| Connection | IP, system, protocol, port and account, to correct them. Update reconnects with that data. The saved password is not shown, so you type it again. |
All of this works the same for an access point.
Reason for absence
Only shown while the device is absent. If you know why it is not there, you mark it as Suspended, Technical or Retired (with Absent the app says it). The Session cell shows your label instead of "Absent".
- The label is informational: the app keeps trying to connect. To make it stop, use Switch session off.
- With a reason set, the app does not ask you to step in for that device, because you already know what is going on.
- It is saved in the project and clears itself when the device comes back, with a notice in the bell: "A labeled device came back".
Notify on reconnection
You mark the device and the app tells you when it reconnects, in one of two modes: Once, which notifies and clears itself, or Always, which notifies on every drop and recovery until you remove it. If the device is muted, the notice waits until you unmute it. Details in Sentinel.
When the app needs you to step in
There are three cases the app cannot solve on its own. In all three it pauses the session, paints the Session chip violet, leaves a notice in the bell and shows in Actions what it needs from you: the "Needs your attention" card with Try again, or the comparison of a possible replacement.
| Case | What happens | What you do |
|---|---|---|
| Unknown IP | It does not answer at its IP and the app has no way to find the new one (for example, its AP sees it connected but does not know its IP). | Type the new IP in Connection, or press Try again once you have sorted it out. |
| Account rejected | The account is rejected at its IP and the device does not show up anywhere else. | Correct the account or the IP in Connection, or press Try again once you fix it on the device. |
| Possible replacement | Another device with the same name answers at its IP. | You decide in the comparison below. |
Try again resumes the session with the saved data. If the device comes back on its own, the request is withdrawn and the notice stays in the bell.
Possible replacement
When you swap a radio for another and give it the same name, the app does not take it for granted. It puts both side by side (name, MAC, model and firmware, IP, AP and when it was last seen) and marks what does not match.
- With "Yes, it replaces the old one", the new one inherits its place: name, baseline, ports, coordinates, silences and notices, and the credential. Earlier snapshots keep the old one with its MAC, and when you compare them you will see "Replaced by …" / "Replaces …".
- With "No, they are different devices", the one that answered goes to Detected and the app keeps looking for the registered one. It does not ask again about that same pair.
Ports the sentinel watches
The tab shows one card per port, with its real state (no cable, speed, half duplex) and a switch. The sentinel only warns about ports that are switched on. It works for any station or AP, even with a single port: switching off the only one takes it out of the watch.
- The first one comes on by default. Switching them all off is allowed; the tab warns you about the consequence, but does not stop you.
- The change applies as soon as you press.
- Ports you do not watch are still drawn in the Ports column, with their state in the tooltip, but without severity color and without raising alerts.
- One alert per device, even if two watched ports go down.
- The choice belongs to the device and not to the row: on a router with two radios it applies to both rows.
Name them on the device
Each port is shown with its interface name. If you renamed it on the device, the sentinel's alert uses that name instead of ether3, and "Sector norte lost its cable" is understood without going to look.
The app does not guess which one carries the service
Deducing it from the device's default route does not work: put a radio in station mode and the route goes out over the air, so ether1 stops being the exit. You know which one it is, which is why you choose it.
The session log
The Log tab is that device's record: what the app tried and how it ended, line by line and in order, each with its date and time. With it you know what happened without waiting to see whether the row comes back.
24/09/2026 20:14:03  Session lost
24/09/2026 20:14:03  Attempt (after losing the session) → 10.10.1.62 · HTTPS:443 · no answer, timed out
24/09/2026 20:14:11  Ping to 10.10.1.62 · no answer
24/09/2026 20:14:12  Its AP SP-PSA60-17 sees it at 10.10.1.88
24/09/2026 20:14:13 IP updated 10.10.1.62 → 10.10.1.88 (its AP)- It keeps the last 100 entries per device while the app is open. It is not saved in the project and does not travel in a snapshot.
- Copy puts it on the clipboard, to paste into a report or an email to support. Clear empties it, to see only what happens from that moment on.
When a device goes absent
A station or AP that loses its session goes Absent, keeps its last reading, and the app takes care of getting it back:
- It watches it with ping and logs back in as soon as it answers, or as soon as its AP sees it connected.
- If it changed IP, the app looks for it in its AP's station list, in the other APs' lists and via ARP on this PC's network. If it finds it, and on logging in confirms it is the same device, it reconnects at the new IP on its own and tells you. If the one that changed IP is an AP, it also leaves a notice in the bell, because for an AP that is not normal. An absence label you set by hand does not stop the search, and it clears itself when the device comes back.
Meanwhile, the Session chip says what is going on:
| Chip | What it tells you |
|---|---|
| Reconnecting | It just lost the session and the app is retrying. |
| Searching | It does not answer at its IP and the app is looking for it elsewhere. |
| Possible cut | Its AP sees it connected with its Fallback IP (a likely administrative cut, like a PPPoE cutoff for non-payment), or the device drops and comes back over and over. The link is not the problem. |
| Blocked at the AP | Its AP's access list does not let it connect. It is neither a fault nor a power-off. On airOS it is only detected with a full-access account on the AP. |
| Cut at its AP | A firewall rule on its AP (a routing MikroTik) drops its traffic. |
| No network on this PC | The one that lost its network is your PC. In that case you get a single notice, "This PC lost its network", instead of one per device, and another when it is back. |
| Out of service | One radio of a multi-radio device vanished from its reading: it is disabled or out of service, and the rest of the device is still online. |
| Absent | There are no further clues: it is off or unreachable. |
The chip's tooltip gives the detail and when it was last seen, and the Log tab tells each step. If what the app needs is an IP or an account only you know, the chip turns violet.
Modulation: both directions
The column shows down and up separated by a slash, 8x/1x, because each direction can fail on its own.
The column used to show only the downstream, and a field case made it grow. A customer who kept dropping out was receiving at 8x and transmitting at 1x, the slowest modulation there is, with the signal at −43 dBm, balanced chains, noise at −86 and CINR at 37. No diagnosis axis caught it, because they all describe how the device receives. The column said 8x, and that number was reassuring about a faulty device.
How to read the pair:
- If both drop together and in proportion to the signal (
6x/6xat −67 dBm), the picture is bad but coherent. That is a misaligned antenna, and those customers rarely report outages. - An asymmetry with a pristine signal (
8x/1xat −43 dBm) is another matter: the transmitter is stuck. It survives moving to another AP and clears by restarting the radio. - If one side is missing, it is painted
—in its place. Half a blank column would hide precisely the faulty direction.
On devices that publish no index (airMAX on airOS 6 and every RouterOS), the column shows both rates in Mbps. It is the same measurement in the notation each firmware hands over: the rate of the last packet, which is not the link capacity.
The signal tooltip is the diagnosis
Hovering the signal cell shows the full multi-variable diagnosis: state, causes in plain words (signal below what its distance should give, noise, channel interference, latency, capacity), SNR/CINR and distance. The traffic light and diagnostics guide explains how to read each cause.
Latency: the average and the peak
The cell shows two numbers:
- The big one is the sustained average, and it answers "is it usually high?".
- The small
▲is the peak of the last 2 minutes. It only appears when the link is really struggling and the jumps are persistent, and it answers "does it spike often?".
The tooltip carries the detail: average, peak with its age, and the share of time spent over the threshold.
There is an optional third number. With Ping from SignalScope switched on (Preferences → General, Network probe section; off by default), the cell adds the ping from SignalScope to each online station, with its loss, and then reads 2 ms / 57 ms.
Two measurements that need not match
The radio's latency measures the air hop alone. The ping from SignalScope crosses the whole path (PC → switch → AP → air → radio). That is why comparing them helps the diagnosis: if they drift far apart, the bottleneck is not in that station's air. When reading the ping, keep in mind that its average only counts the packets that came back, which is why it always comes with the loss next to it.
Ports: one connector per port
The column shows every Ethernet port on the device, in the order the device names them. A single-port radio, like half the fleet, shows one.
Each RJ45 connector summarizes its own port's state:
| Look | Meaning |
|---|---|
| Gray | No data (not a fault) |
| Slashed connector, amber | No cable |
| Amber | Half duplex |
| Red | ≤ 10 Mbps: damaged cable or split pair |
| Blue | Fast Ethernet (100 Mbps), informational and not a problem |
| Green | Gigabit |
100 Mbps is deliberately not flagged as a problem, because many installs use Cat5 on purpose. What does warn is degradation against the device's own history. The app learns the top speed that device has ever negotiated and, if one day it negotiates less, an amber ↓ appears. If the change was legitimate (the cable was replaced), clicking the ↓ accepts that speed as the new normal. The exception is 10 Mbps: it is never an installation decision and cannot be accepted as normal.
There are two reading nuances. The no cable state shows here and the sentinel reports it, but it does not change the row's color, because a router turned off at night or a cutoff for non-payment are not link faults. 10 Mbps, on the other hand, does put the row in Critical: no airMAX ships with that maximum.
When the port is the only problem, the signal is not painted red
The device stays flagged critical and the row stays tinted, but the signal number is painted according to its own value. The problem is pointed at by the Ports column and the diagnosis, which lead to where it has to be fixed. The antenna is fine.
Which ports the sentinel watches is chosen in the Ports tab of the session window.
The column also exists in the AP table, where degradation weighs even more.