Coverage map
The Map is the other main view, peer to the Monitor: your network on the map. You switch with the Monitor | Map toggle in the bar or with Ctrl+M, and when you do, live monitoring keeps running in the background.
It is a design plan meant as a field view. At a glance it shows where your nodes are, what each AP covers and how its stations are doing.
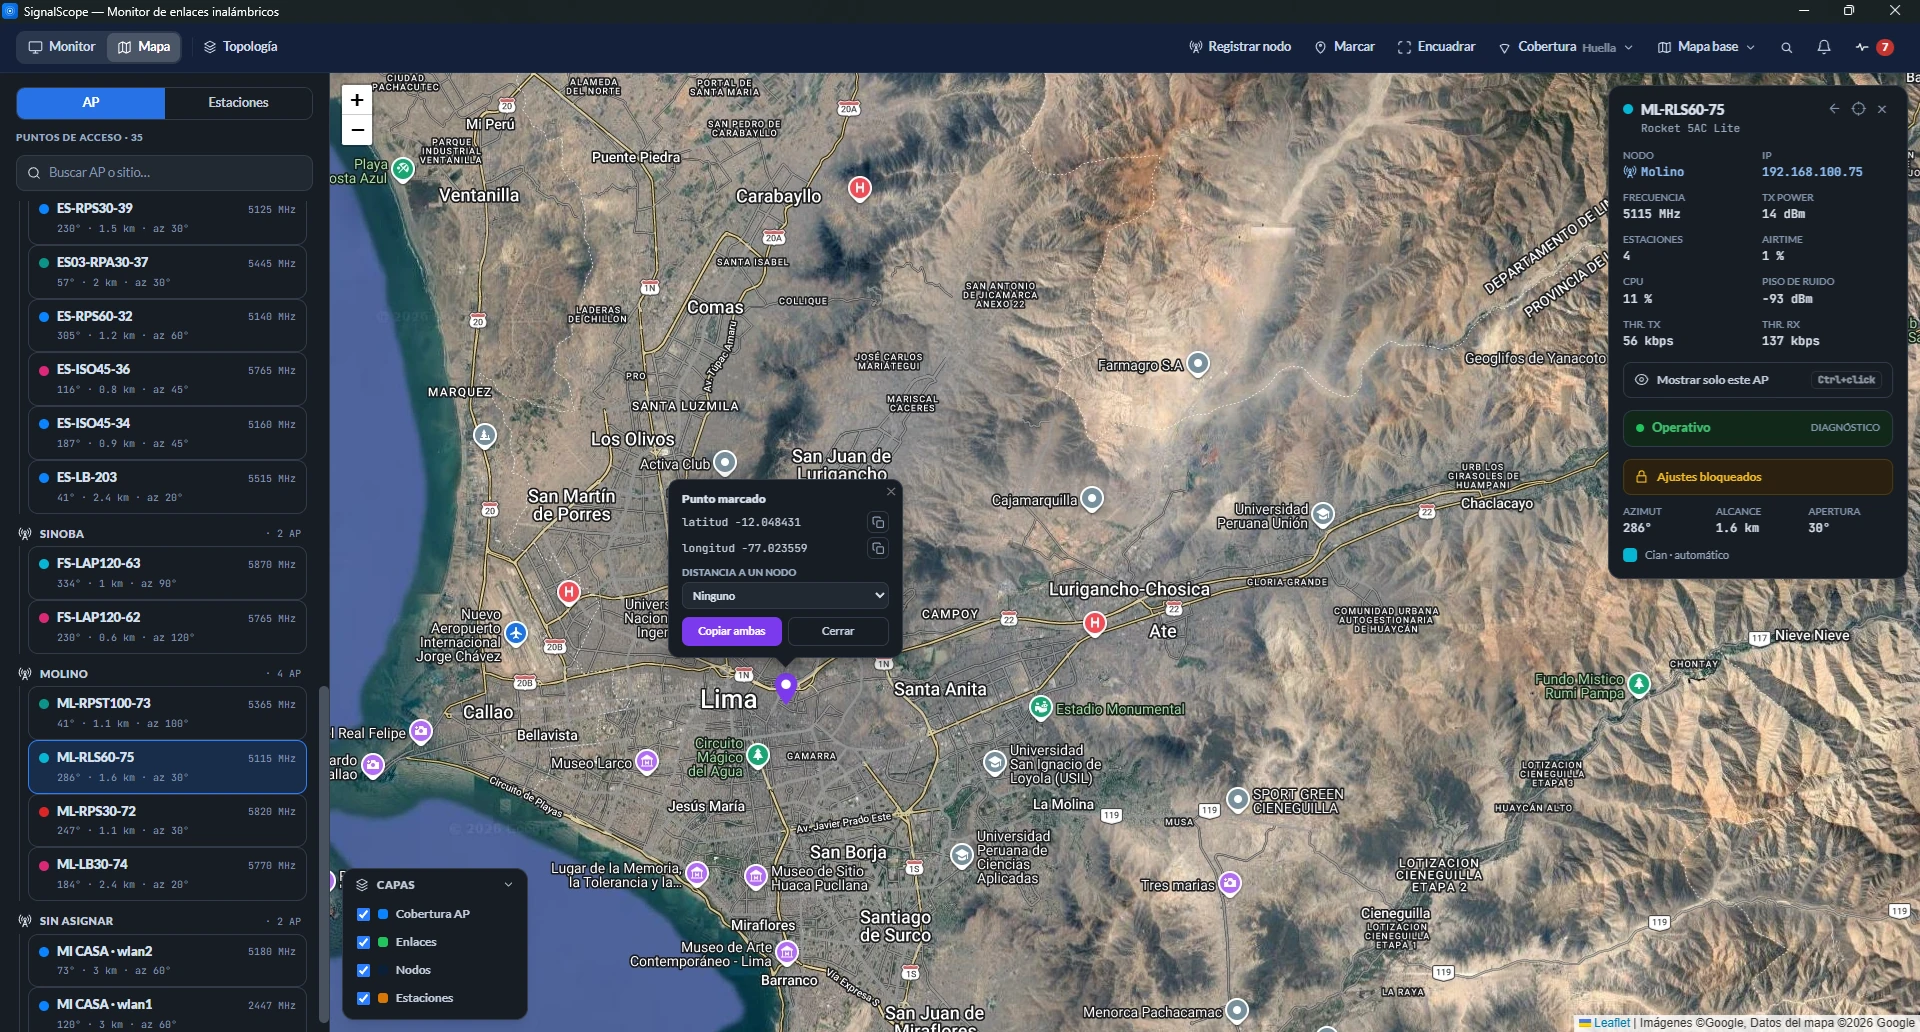
Nodes: the site, not the device
A node is the physical site your APs hang from: the tower, the rooftop mast, the pole. You register it with "Registrar nodo", placing it on the map, and relocate it later with its "Posición" button. In that mode, Enter applies and Esc puts it back where it was.
Its card gathers what belongs to the site: the coordinates, renaming, relocating and the list of its APs, each with its sector color and frequency, so you can read at a glance what that tower has on. From there you also plan an AP that does not exist yet.
Deleting a node deletes its planning
Real APs survive without a node (they are just not drawn). Planned APs do not exist outside their node: deleting it deletes them too, and the dialog says so.
APs and their sectors
An AP is drawn once you assign it to a node; without a node it has no real position. From the "Asignar APs" panel you choose which APs live on each node, with a search box and a free-APs filter, and for each one you adjust its coverage sector:
- Azimuth: where it points.
- Beamwidth: how wide the beam is.
- Range: how far its coverage is painted.
It is a plan, not an RF prediction
The sector paints what you declare (azimuth, beamwidth, range). It does not compute terrain or line of sight, because the app does not promise coverage it cannot verify.
Three ways of drawing coverage
With dozens of sectors over the same neighborhood, the semi-transparent wedges add up, and where four of them cross, the color belongs to none of them. On top of that, the fill speaks of band while the dots and links speak of state: two questions in the same color language.
That is why you choose how it is drawn with the "Coverage" selector in the top bar, next to "Base map". The button shows the current mode without opening it:
| Mode | What it answers |
|---|---|
| Footprint (the default) | "How far do I reach?" Every sector merges into a single surface in a single tone. Two overlapping wedges no longer darken each other, and color is left to the traffic light alone. The range arc stays crisp, so you can still read where each sector ends inside the mass. |
| Focus | "What does this one cover?" The AP you are looking at is painted in full and the rest stay as a one-stroke outline. |
| Detail | Each sector by its band, the full drawing. |
Four details about these modes:
- The focused AP is painted in full in all three modes. Focus comes from the AP you pick as much as from the station you pick (in that case, its own AP is painted).
- Outside Detail, links dim. The state color is reserved for what is focused and the rest turns context gray. Each station's dot still says its state, and that never dims.
- Footprint has a cost: the frequency band can no longer be read on the map. It is still in the colored dot of the side list, in the AP's card and in the frequency planner.
- A planned AP does not join the footprint, because the footprint claims "I reach this far" and there is no device there yet. It stays as a dashed outline.
If you switch off the "AP coverage" layer in the Layers panel, the selector is disabled in place (it does not vanish) and the tooltip says why.
Planning an AP that does not exist yet
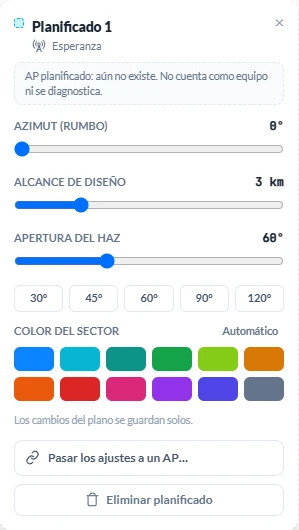
On the node's card, "Añadir AP planificado" draws the sector of a device that is not installed yet. You pick its azimuth, beamwidth and range, and the sector is painted on the map just like a real one, with the same geometry and the same reading. It answers, before buying or climbing to the roof, what would an AP here, aimed there, cover? Does it overlap with what I already have? It is drawing only: it does not count as a device and is not diagnosed, and the card itself says so.
When the install comes, the "Pasar los ajustes a un AP…" button pours the plan onto the real device: it copies the geometry, assigns it to the node and removes the planned one, all in a single operation. Since it overwrites a real device's settings and there is no undo, it asks for confirmation showing exactly what will be replaced.
Stations on the map
Stations are placed by their own coordinates, the ones the radio has registered (Location/GPS in its interface). Without coordinates, a station is not drawn: its card says so and the search list marks it "No coordinates". That is deliberate, so the real location gets registered on the antenna, where it is useful to any tool and not just to SignalScope.
Annotating the position of a MikroTik
RouterOS does not allow writing coordinates to the device, because its GPS package is read-only. For these devices, and only for these, the app lets you annotate the position by hand:
- Mark the point on the map where the station is.
- In the point's bubble, pick it under "Annotate the position of" and press "Annotate here". You can also start from its card, with "Annotate the position on the map".
The app honors two rules:
- What you annotate is stored in the project, not on the device. The app says exactly that: "SignalScope publishes it, not the device".
- It never overrides what the radio reports. If that device ever reported its own position, the radio's would win.
On airMAX that option does not exist, and that is deliberate: there coordinates are registered on the radio itself.
What the map says with its drawing
- Each dot's color is the full diagnosis, the same verdict as the Monitor and not signal alone. The map dot and the table never contradict each other.
- The link is drawn to the real AP. The line goes from the station to the AP it is actually associated with, not to the nearest node. If that AP is not on the map, the station is drawn without a line.
- An absent station is drawn hollow. It keeps the color its link was in (dashed ring, faint fill) and its card says "Absent · seen N ago". Falling while critical is not the same as falling while fine, and the hollow tells you that color is a memory.
Searching and moving around
The side search drives the view: clicking a result (station, AP or node) selects it and centers the map on it, zooming in if needed and never out. The selected station gets a halo and its link becomes a solid line, which reads as "this one, and it hangs off that AP". The global search (Ctrl+K) works here too: it opens the device's card, centers the view and leaves only what you picked on screen.
To move around the plan:
| Gesture | What it does |
|---|---|
| Ctrl + click on an AP | Selects it and leaves it alone on screen, with its sector and its stations. The same gesture on the same AP brings everything back. It works on the sector and on the side list. |
| "Mostrar solo este AP" / "Mostrar solo esta estación" | The same isolation, from the card's button. |
| Esc | Closes whatever is open, most recent first: the marked-point bubble, then a panel open inside a card, and finally the card. It also exits the marking and node-placing modes. |
| Arrow ← in a card's header | Goes back to the previous card, for example from a station to its AP and back, without hunting for it on the map again. |
| Crosshair | Centers the map on the selection. Never relocates: moving the node is the "Posición" button. |
Small sectors stay on top
Sectors are drawn from largest to smallest area, so the smallest is always on top and can be clicked even when a large sector covers it. The key is the area, not the range: a 360° omni at 1 km covers more than a 30° wedge at 3 km.
Support tools
Marking a point
Mark drops an ephemeral pin to copy coordinates (latitude and longitude, together or separately), handy for pasting into a freshly installed antenna's interface. It is not saved in the project, and its "Close" button removes it from view.
The point's bubble also carries two tools:
- "Distance to a node", a dropdown with all your nodes sorted by proximity, each with its distance, so it answers the question without picking anything. Choosing one draws the line to it with the measurement on top. The line is dashed on purpose: on this map a solid line already means a real link between two devices, and here there is only a ruler over a point you are considering.
- "Annotate the position of", which records that point as a MikroTik station's position (see above).
The distance is a straight line over the globe and it is not an RF prediction: it takes no account of terrain, Fresnel or mast height.
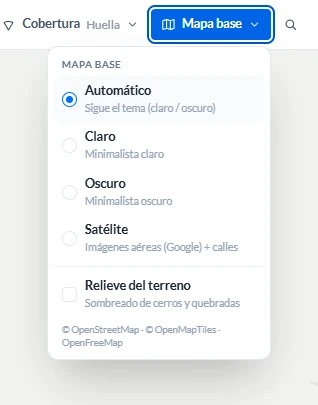
Base map
The "Base map" menu has up to four options. The privacy detail is in Security and privacy.
| Option | What it is |
|---|---|
| Automatic | Follows the app's theme. |
| Light / Dark | The two street plans, served by OpenFreeMap, with no key, no registration and no quota. |
| Satellite | Google Maps imagery. It only appears if you supplied your own key (see below). |
Underneath, separated by a line, there is a separate checkbox:
- Terrain relief: hillshading of ridges and valleys, off by default. It shows the hill that cuts a link, which is what you look for on the plan. It is not a substitute for satellite, and the app says so: it is bare terrain (~30 m) and shows no trees, buildings or rooftops. It is computed on your machine from open elevation data. Over the satellite base map the checkbox is disabled.
Satellite with your own Google key
The Satellite option only exists once you configure a Google key with the Map Tiles API enabled, in Preferences → Map. The key is yours and bills to your Google account, which carries its usage. SignalScope checks it before accepting it and stores it in the Windows credential vault; it is not saved in or shared with the project.
With a key active, the field to type one does not appear: to change it, press "Remove" first.
The map travels in Snapshots
Every Snapshot freezes that moment's plan. Opening it, or a shared .ssnap, draws the Map exactly as it was then, read-only. If you ticked "Do not record location" in the Snapshots' privacy settings, the Snapshot goes without a map; see Sharing.