Detected and References
These two tables have opposite roles. Detected is the scan's work queue and it empties. References is the permanent inventory of what you do not manage but look at for contrast: the node's router, your provider, a domain like Google.
Detected: the scan queue
Everything a scan finds that has no identity yet lands here, with its IP, MAC and manufacturer. The Suggestion column hints at what each device looks like:
| Suggestion | What it means |
|---|---|
| Ubiquiti radio (blue) | An airMAX candidate. You get in with the session button. |
| MikroTik radio (blue) | A RouterOS candidate. If it has a wireless module it comes in like an airMAX; if it does not, the login itself will tell you, and that device belongs in References. |
| Manufacturer device · not airMAX | Known manufacturer, but no driver in the app. |
| Not airMAX | Unknown manufacturer. |
| MAC not reachable | It sits behind a router; when you sign in it identifies itself fully. |
On the two rows that say "not airMAX", the Session column shows not manageable instead of the sign-in button.
The suggestion tells you the manufacturer, not the system
A device being a MikroTik does not say whether it is a tower sector, a switch or a desktop router, because RouterOS runs on the whole catalog. All the suggestion promises is that a session can be attempted. The device says what it is once you are in.
Each device leaves the queue in one of two ways:
- By signing in. You pick its system, and the radio declares its mode and moves on its own to Stations or Access points.
- With "Move to References…". The device goes down to the inventory. The same registration form opens, where you give it a name and decide right there whether to monitor it. The decision is stored and a later scan will not ask again.
The suggestion helps, but the decision is yours. The "Move to References…" button is highlighted when the manufacturer already says there is no driver, and stays discreet on a manageable radio, where setting it aside would almost always be a mistake.
Clear list empties the queue without deciding anything: whatever is unresolved comes back on the next scan. Once the queue hits zero, the table disappears from view.
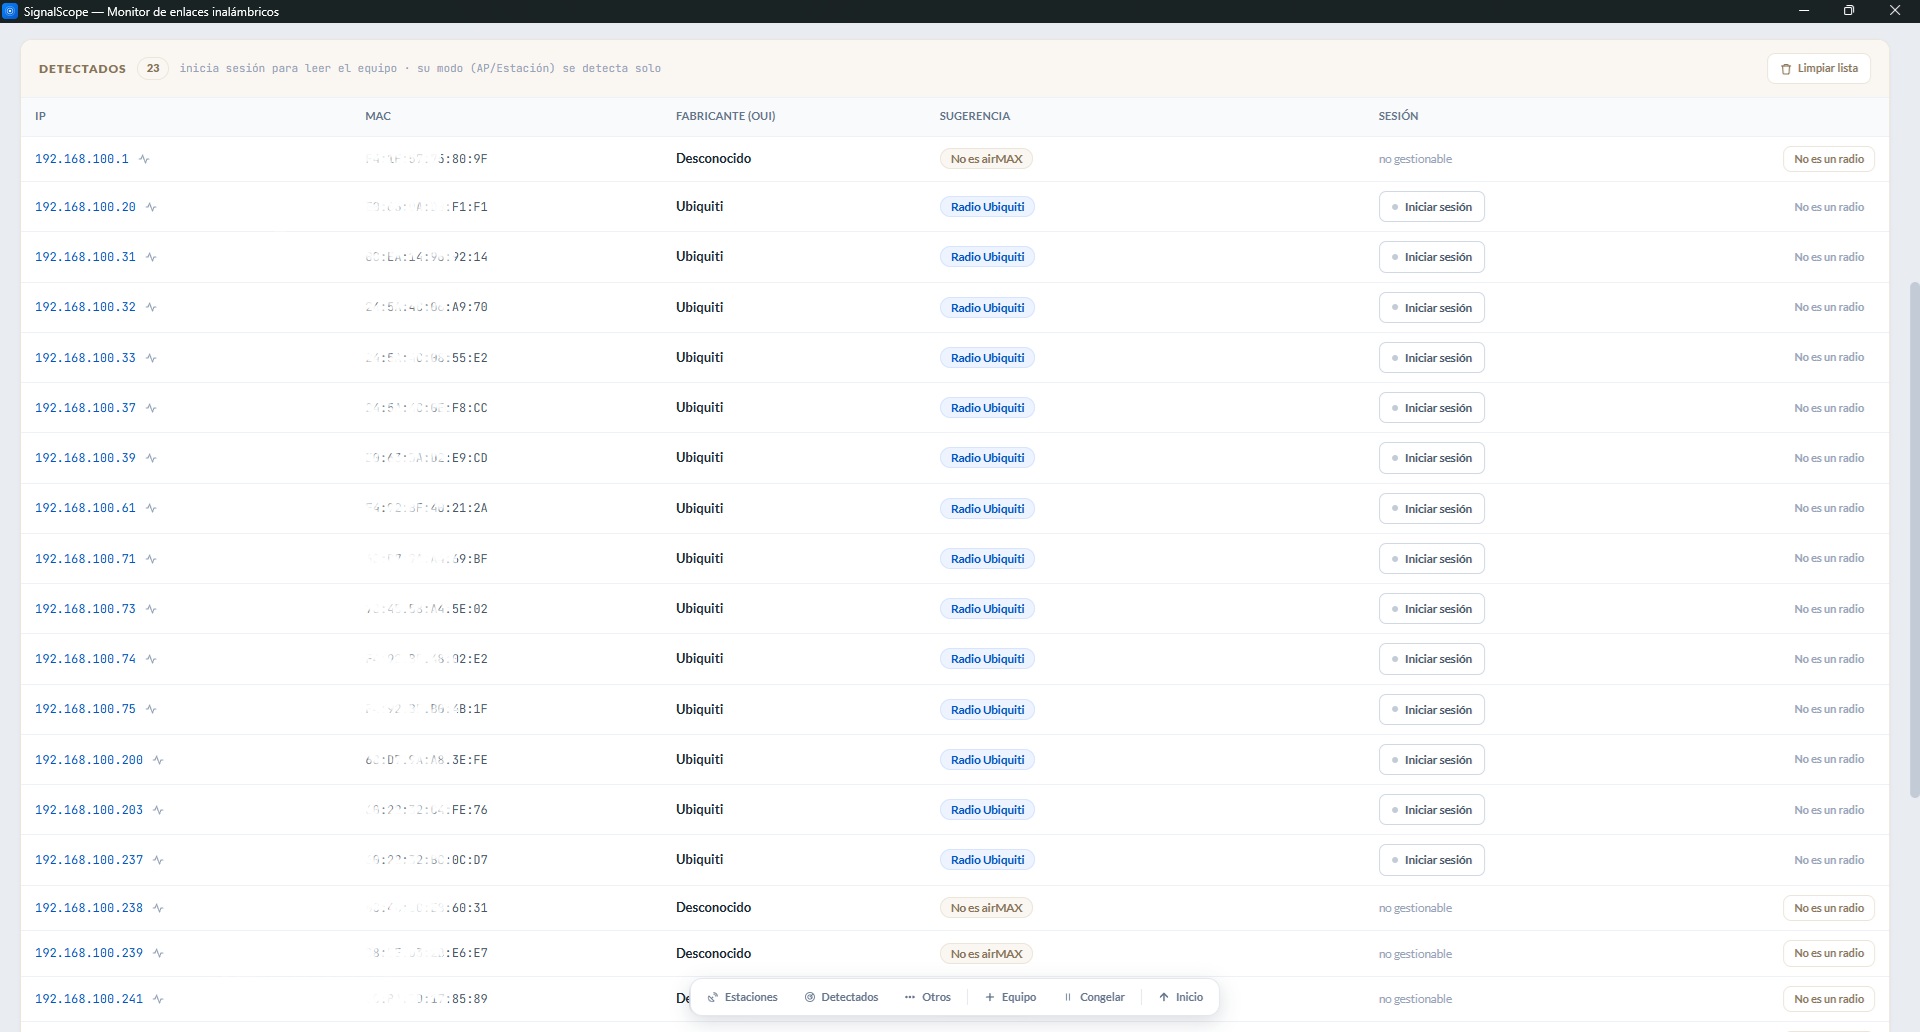
When it finishes, the scan tells you how many devices answered and takes you to this table. A finding with a MAC is presented even if another of your devices held that same address before, which is normal where IPs are handed out automatically. When it is an AP that declares its stations, its notice separates the new ones it added to Detected from the ones you already had.
References: what you look at for contrast
This is where a switch, an ONU or the node's or customer's router go, and also targets outside your network: your transit provider's public IP or a domain like google.com. The app does not manage them, but they tell you whether the problem is yours or further up. Each row is a target.
The References table is always visible, even when empty, and its search box appears as soon as it has rows. In the sidebar you recognize it by its chain-link icon.
| Column | What it shows |
|---|---|
| Monitoring | The state of the ping to that target. Clicking the chip opens its actions (see below). |
| Latency | The response time and, beside it, the percentage of pings lost over the last two minutes: 5 ms · 20 %. The tooltip spells it out with "Ping from SignalScope" and "Loss over the last 2 min". |
| Name | Editable in the table: Enter or leaving the field saves, Esc discards. |
| IP / domain | The target's address or name. |
| MAC | Identity, where there is one. A routed device has no visible MAC and the cell says IP only; a domain shows —. |
| Vendor (OUI) | The manufacturer the MAC gives away. Without a MAC, —. |
Adding a target
There are two routes, and both open the same form, "Add to References":
- From Detected, with "Move to References…" on its row. The address is already known and is shown fixed.
- By hand, with "Add target", top right of the table. When the table is empty, the same link also shows in its middle.
The form has three fields:
- IP address or domain, only in the manual route. It accepts an IPv4 address or a name. It does not accept IPv6 or a port, because it only checks whether the target answers.
- Name, mandatory and unique. It is how the alerts will name it at three in the morning, and two "Router"s in a WhatsApp message are no use to anybody.
- Monitor this target, which comes switched on. That way the target is in the sentinel's custody from the moment you save. Turn it off if you only want it on record.
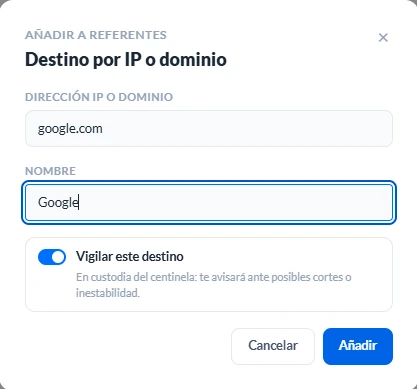
Monitoring: "is it still alive, and how does it answer?"
With monitoring on, the app sends a ping every 2 seconds from SignalScope and the target is in the sentinel's custody, which notifies you of possible outages or instability. The Monitoring chip has five faces, and each is a distinct fact, not a degree of the same thing:
| Chip | What it means |
|---|---|
| Not monitored (off) | Nobody is checking whether it answers. It stays like this if you turned monitoring off when adding it or from its actions. |
| Checking… | On, but without the first ping yet. |
| Monitoring (green) | It answers, and the app verified that whoever answers is that device. |
| Another device / Does not resolve (amber) | Another device: that IP is now held by a different box; a scan finds yours again at its new address. Does not resolve: the name could not be resolved to an address, so the question was never asked. It does not count as an outage and raises no alert; what to look at is on your machine. |
| No answer · 5 min ago (red) | It does not reply, with the "how long ago" attached. |
The loss percentage is the half that matters
A target that drops and comes back answers fine most of the time, and looking only at the response time it would seem healthy. The loss is what gives it away. The time turns amber from 120 ms and never red. The loss is painted amber as soon as there is any, and red from 10 %.
When a monitored target stops answering, the sentinel reports it as "References not answering". It is useful, for example, for a node's router, whose outage explains that of every radio hanging off it. Like any alert, it can also reach you as a Windows notification or on your phone.
Target actions
Clicking the Monitoring chip opens its actions:
- Monitor target: puts it in the sentinel's custody, or takes it out.
- Notify on reconnection: the app tells you when it answers again, once or every time. See Sentinel.
- Remove from the project: deletes every record and diagnostic action.
What monitoring is NOT
- It does not measure link quality. It is a ping from SignalScope, so it drags in your local network and the whole path in between. The Latency column in Stations is measured by the radio over its own air segment, and the two share no thresholds.
- It opens no session and reads no configuration. About a reference the app only knows whether it answers and how long it takes.
- It does not follow a target that changes IP when its identity is the IP (routed or added by hand), because there is no session to re-identify it. With a visible MAC, the scan does re-link it.
Removing is for real
Remove from the project deletes that target's whole record, including the decision to have set it aside. If a later scan finds it again, it comes back to Detected as if it were new. That is also the way to recover a radio moved to References by mistake.
References is not "the leftovers"
It is permanent inventory and survives Clear list; the queue that empties is Detected. Every row in References was put there by you, so none of them is noise, and that is why reports carry them all, monitored or not.