Traffic light and diagnostics
The traffic light tells you which link to look at, and the diagnosis tells you why. Both are judged as described below.
The traffic light
Each station's color is the verdict of the full diagnosis: the worst of its seven axes rules (see below). The main axis, signal, is judged in one of two ways depending on whether there is a baseline.
Without a baseline, the absolute dBm value is judged:
| State | Signal |
|---|---|
| 🟢 Good | ≥ −55 dBm |
| 🟡 Warning | −55 to −67 dBm |
| 🔴 Critical | < −67 dBm |
With a baseline, what is judged is how far the signal dropped from the baseline you set (Δ dB):
| State | Drift |
|---|---|
| 🟢 Stable | up to −3 dB |
| 🟡 Dropped vs baseline | −3 to −8 dB |
| 🔴 Check link | more than −8 dB |
The diagnosis says it with the number: "Signal −10 dB vs its baseline (−54 dBm)".
An Absent station does not count as critical. It lost its session and keeps its last reading, with the reason in the tooltip. What its chip says while the app gets it back is in When a device goes absent.
Baseline: compare against your own network
Without a baseline, the app compares the signal with the signal expected at each link's distance, which the radio itself computes, and falls back to the absolute threshold only when the radio does not provide it. The baseline adds what the app cannot compute: how that link was when the installer left it right, with its alignment, its cable and its obstacles. It is your criterion, and it takes priority over the other two.
When a link is the way it should be, click "Mark". That moment's signal becomes that antenna's healthy point, and from then on the signal axis judges the drift against it (Δ dB) instead of the absolute value.
- The baseline is per antenna and survives reboots and IP changes.
- With a baseline, the Baseline column shows the value (
−58 dBm) and an × ("Remove baseline"). While a baseline is set the "Mark" button is not shown, so updating it (after a realignment, for example) takes two gestures: remove it with the × and click "Mark" again.
Mark while the link is stable
"Mark" stores the reading at the instant of the click, without averaging. If you mark during a fade, the baseline lands on a bad point.
Why signal alone is not enough
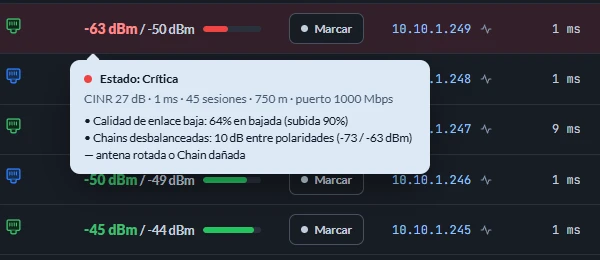
A −54 dBm signal at 1.5 km can be excellent, and a link with a "good" signal can have noise, interference or sunken capacity. That is why the diagnosis combines seven axes and the worst one rules. The result is the row's color plus a list of causes in plain words, shown when you hover the signal cell.
The seven axes
- Signal in context. With a baseline, the drift against it. Without one, the gap to the signal expected at that distance (warning at more than 3 dB below, critical at more than 7 dB). If the radio does not report the expected signal, the absolute threshold from the table above.
- Channel quality. The margin between signal and noise floor (SNR) or, on devices that report it, CINR, which also sees interference from other transmitters on the channel. Warning below 24 dB, critical below 15 dB. This is where causes like "Channel interference: CINR … dB (signal looks fine, the channel doesn't)" come from.
- Link quality. The airMAX indicator, averaged so bursts don't raise alarms: below 90 % asks for attention and below 70 % is critical. It includes the air latency measured by the radio. A sustained average above 12 ms asks for attention and above 24 ms is critical, and recurring spikes also degrade the verdict ("congested channel, signal is fine").
- Real vs. expected capacity. If the link delivers less than 65 % of what its modulation promises, on download or upload, something is holding it back: saturation or degraded modulation. Below 40 % it is critical.
- Ethernet port. The wired stretch up to the radio's connector. Half duplex marks Warning and a port negotiating 10 Mbps marks Critical: damaged cable, moisture in the connector or loose PoE. No airMAX ships with 10 Mbps as its maximum. A port with no cable does not change the color, because it can be the router turned off at night or a cutoff for non-payment rather than a link fault. That fact shows in the Ports column and the sentinel notifies the change. Port speed only appears in the diagnosis when it limits what the radio could deliver.
- The app reads every port on the device. The diagnosis judges the port the sentinel watches (the first one, if you watch several), and you pick which ones are watched in the Ports tab of the session window. With no choice made, the first port is watched.
- This axis applies to APs too, with the same two rules and the same boundary. An AP whose uplink port negotiates 10 Mbps or half duplex strangles its whole sector.
- When the port is the only thing wrong, the signal number is not painted red. The device stays Critical and the row stays tinted, but the signal is painted for what it is worth. The problem is pointed at by the Ports column and this axis, which is where it gets fixed.
- Chain imbalance. The antenna's two polarities should receive almost the same. A difference of 5 dB or more (critical from 10 dB) betrays a rotated antenna, crossed polarization or a damaged chain, even when the total signal looks normal. No other axis detects it.
- Radio health. Saturated CPU or exhausted memory: warning from 80 % CPU or with 10 % or less free memory, critical from 95 % CPU or with 5 % or less memory. A choking radio drops packets without the signal changing.
How to read a cause
Each cause names the fact and its context: "Signal 12 dB below expected at its distance", "High noise: SNR 14 dB", "Downlink well below expected: 23 of 80 Mbps". That tells you where to look (the cable, the channel or the alignment) before climbing to the roof.
The AP is judged differently
An AP does not have "one link" to judge, it has fifteen. Its State column combines channel load, radio health, its sector's latency and its uplink port. The detail is in Access points.
The blind spot no axis sees
The seven axes describe how the device receives, and none of them looks the other way. A radio can receive perfectly and transmit at the slowest modulation there is, with a pristine signal and balanced chains.
That case shows up in the Modulation column, which displays both directions. It is informational and does not change the traffic light, but it is the only thing that sees it: looking only at the downstream, that antenna would seem fine.
About the thresholds
The numbers in this guide are the current version's, calibrated against real networks. Some, latency's in particular, are still being field-calibrated and may change between versions. The tooltip always shows the measured values, so you can judge with your own criteria alongside the app's.
Help → "How calibration works" sums up the method behind each limit, with real cases, and invites you to report yours to support@materis.io. The adjustments come from those reports.
On MikroTik, the traffic light is not calibrated yet
A RouterOS device's thresholds are currently airMAX's. They were reviewed axis by axis (signal, chains, CPU and memory are physics and percentages and do not depend on the vendor), but they have not been checked against real MikroTik links.
Send us any report at support@materis.io.